
- Engineering observability tools like LangSmith and Langfuse are built to improve reliability and reduce token cost, not to detect unauthorized agents, over-privileged tool grants, or prompt exfiltration paths. Security teams that inherit these dashboards get trace data without the control plane context they actually need.
- The first problem is inventory: most organizations cannot name every agent running in production, let alone every one deployed by a business unit without security involvement. Shadow agent discovery requires network-level and OAuth grant analysis, not just trace aggregation.
- The split between engineering observability and security discovery maps cleanly to different buyer personas, different data models, and different alert types. A single tool rarely serves both well.
- Per-trace pricing sounds cheap until a high-frequency production agent hits 40 million traces a month. Understand the pricing model before the agent fleet scales.
- Self-hosting matters here more than in most security categories because agent traces frequently contain raw user prompts, PII, and internal system context. Data residency is a compliance question, not a preference.
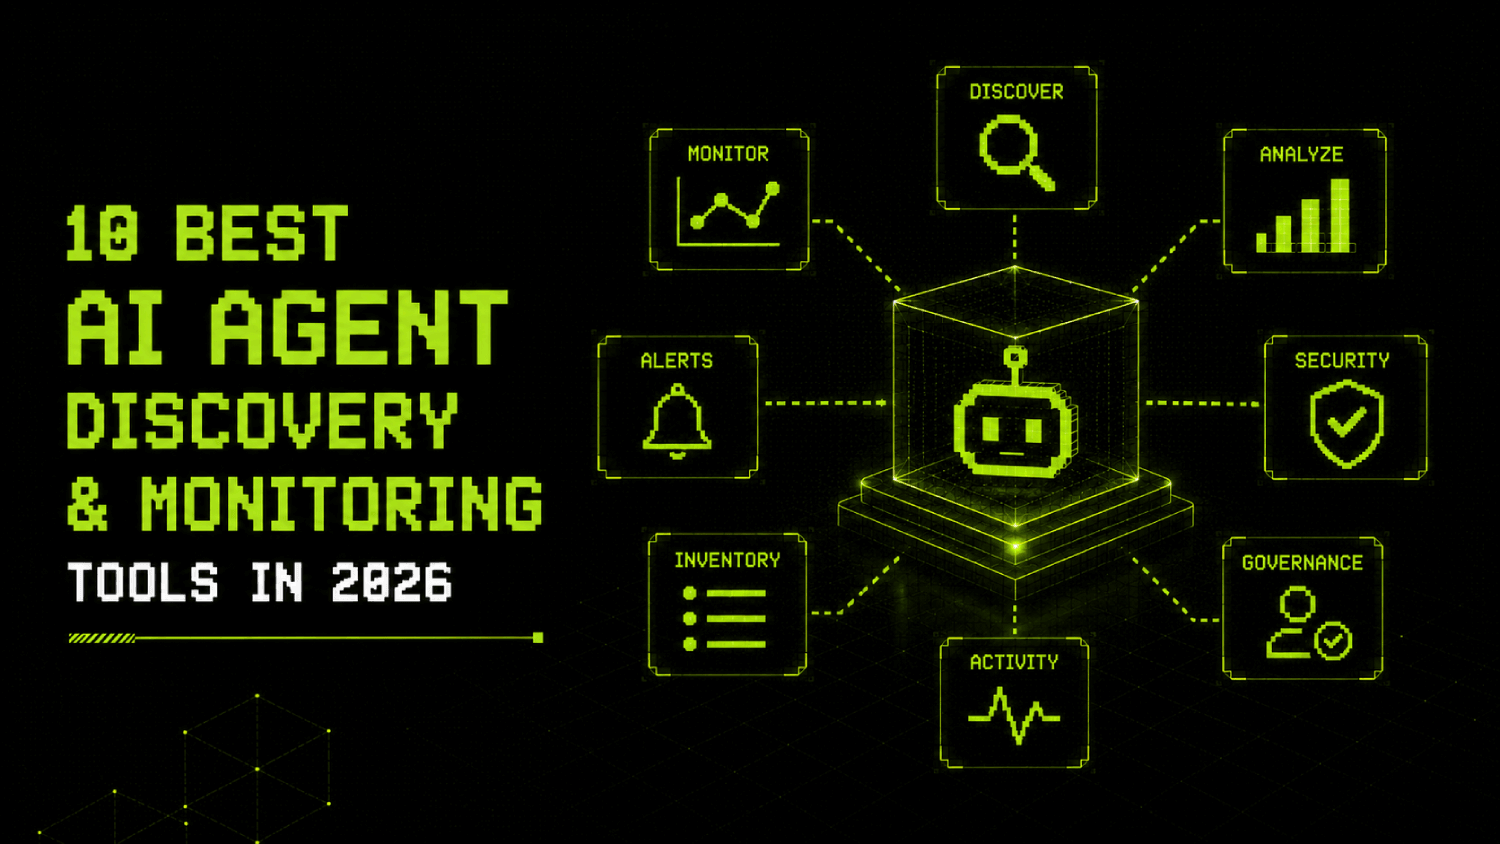
The best AI agent discovery and monitoring tools for security teams in 2026 split into two categories: engineering observability platforms that instrument agent behavior for reliability and cost, and security-focused discovery tools that find agents nobody registered, audit what those agents can access, and detect anomalous behavior at runtime. Tools like LangSmith, Langfuse, Arize, and Braintrust belong to the first category. Tools like Zenity, Noma Security, Obsidian Security, Wiz, and Prompt Security belong to the second. Buying from the wrong category leaves real gaps.
Why Your LLM Observability Stack Is Not Your Agent Security Inventory
Engineering observability tools are instrumented by developers. That is their structural weakness from a security perspective. A tool only appears in LangSmith or Langfuse if the team that built it added the tracing SDK. An agent deployed by a marketing operations team using a low-code platform, or a business analyst who connected a third-party AI service via OAuth to a production SaaS environment, will not appear in that trace view at all.
This is the shadow agent problem. It mirrors shadow IT but moves faster, because the same SaaS integrations that took IT months to discover in 2015 now get deployed in an afternoon with a single OAuth grant. Security discovery tools that pull from identity provider logs, SaaS OAuth grant tables, and network egress records find these agents. Trace-based observability tools do not.
The second structural gap is signal type. Engineering observability tracks latency, token consumption, output quality scores, and retrieval accuracy. Security monitoring needs different signals: which external endpoints an agent calls, whether a tool grant scope has expanded since deployment, whether an agent is accessing data stores it was not originally authorized to touch, and whether prompt inputs contain patterns consistent with injection attempts. These signals exist in different data sources and require different detection logic.
The SecurityOpsWire Observability-vs-Discovery Split: How to Frame the Decision Before You Buy
Before evaluating any specific tool, categorize your actual requirement. The framework below, which we call the Agent Visibility Stack, separates the four distinct visibility problems teams conflate when they search for a single solution.
| Visibility Layer | What It Answers | Primary Signal Source | Right Tool Category |
|---|---|---|---|
| Inventory and discovery | What agents exist and who owns them | OAuth grants, API gateway logs, SaaS audit logs, network egress | Security discovery (Zenity, Noma, Wiz, Obsidian) |
| Runtime behavior monitoring | What is an agent doing right now and is it anomalous | Tool call logs, LLM API telemetry, data access events | Security monitoring or CNAPP with agent coverage |
| Prompt and trace observability | Why did the agent produce this output and how do I improve it | Trace spans, token counts, retrieval chunks, latency per step | Engineering observability (LangSmith, Langfuse, Arize, Braintrust) |
| Content and policy enforcement | Did this agent send or receive content that violates policy | Prompt content, output classifiers, data loss patterns | AI firewall or gateway (Prompt Security, Lakera) |
Most teams need layers one and two covered before layer three adds value. Running LangSmith on an agent fleet with no inventory pass is like deploying an APM tool before finishing asset management: you get deep visibility into the things you already know about and zero visibility into the rest.
Engineering Observability Tools: What They Do Well and Where They Stop
LangSmith
LangSmith, built by the LangChain team, is the most widely deployed trace and evaluation platform for teams building on LangChain or LangGraph. It captures full execution traces including tool calls, retrieval steps, and LLM inputs and outputs. The evaluation framework lets engineering teams run automated tests against golden datasets, which matters for catching regression in agent behavior before deployment.
From a security standpoint, LangSmith’s coverage is limited to agents that have been instrumented with the LangSmith SDK. There is no discovery mechanism for agents built outside LangChain. The platform does not connect to identity providers or SaaS OAuth tables. LangSmith does not publicly disclose pricing and quotes per seat and usage tier. According to LangSmith’s official documentation, the platform offers managed cloud, bring-your-own-cloud (BYOC), and self-hosted options for teams with data residency requirements; Enterprise plan options require contacting the LangChain team. For teams that have already standardized on LangChain, it is the right engineering observability choice. For security teams trying to build an agent inventory, it answers none of the relevant questions.
Langfuse
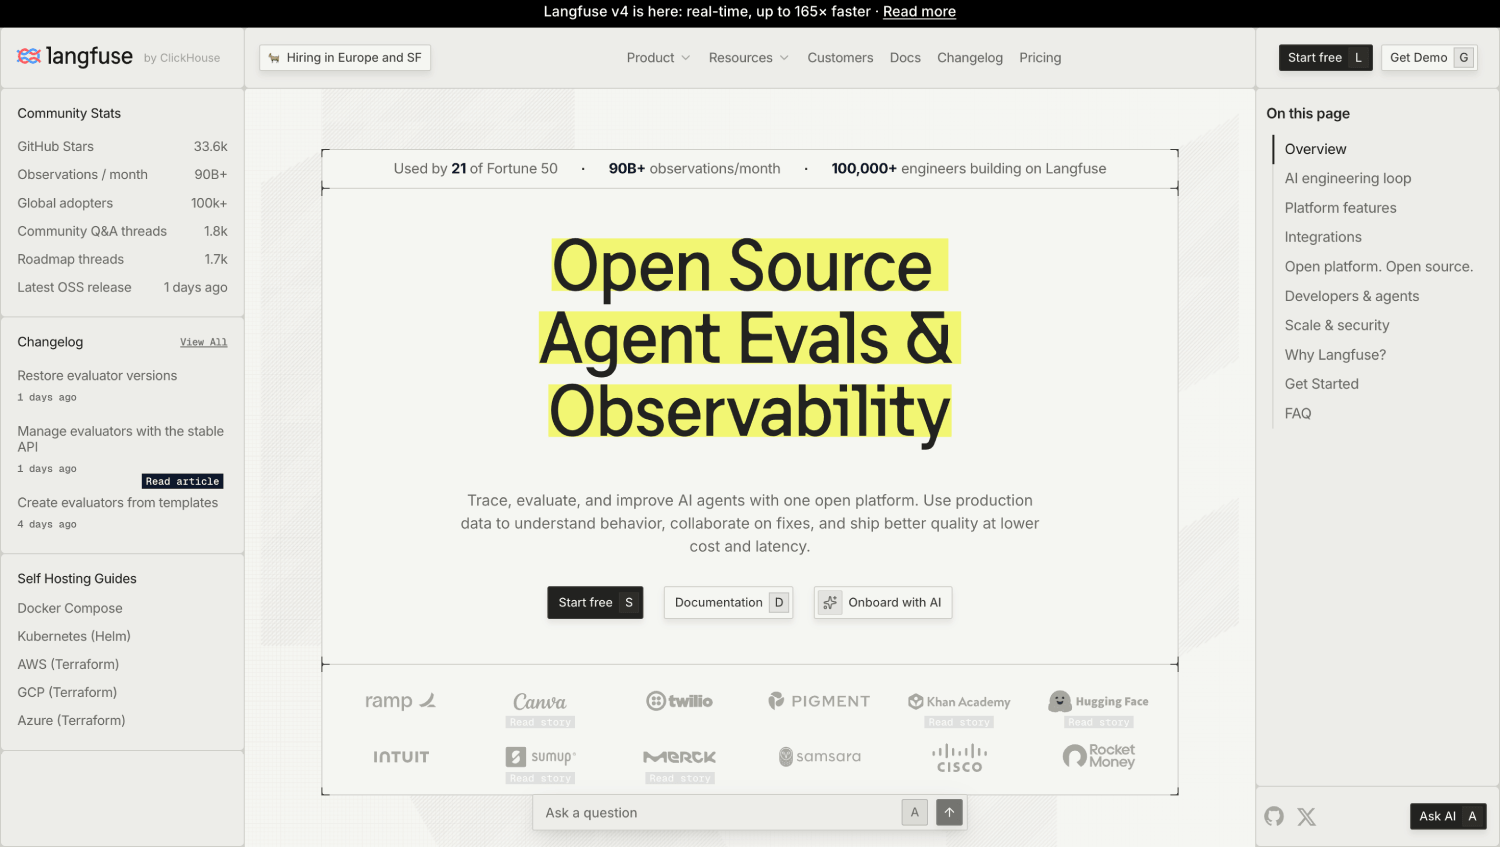
Langfuse is an open-source LLM observability platform that supports multiple frameworks through OpenTelemetry-compatible tracing and a Python and TypeScript SDK. Its self-hosting option is a genuine differentiator for teams with data residency requirements: agent traces, which can contain raw user prompts and internal context, stay within the organization’s own infrastructure when Langfuse runs on-premises or in a private cloud deployment.
Langfuse’s cloud offering is available on a free tier with usage-based pricing above that. The self-hosted version is free to run with standard infrastructure costs. Because agent traces frequently contain PII, internal knowledge base content, and user queries, self-hosting Langfuse is worth evaluating seriously before sending that data to any third-party SaaS. The platform is not a security tool, but its data residency story is stronger than most competitors in this category.
Arize AI
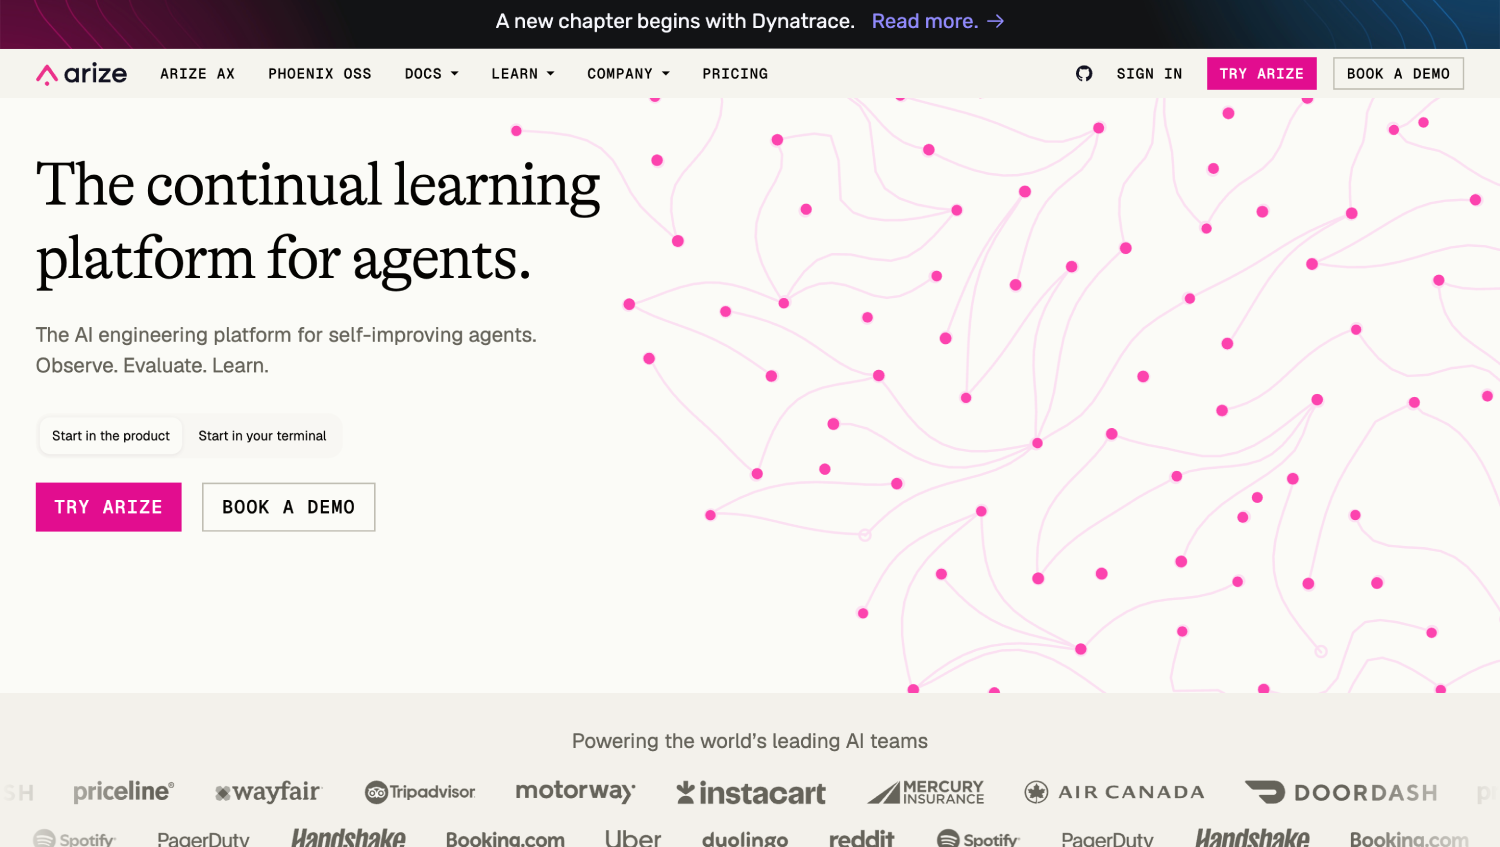
Arize AI covers both traditional ML model monitoring and LLM observability through its Phoenix and Arize platform products. Phoenix is open-source and supports trace visualization and evaluation; it can be self-hosted for local development and evaluation workflows. The commercial Arize platform adds production monitoring, drift detection, and evaluation at scale and is offered as a managed service. For teams running agentic workflows in production and needing to understand output quality degradation over time, Arize is a serious option.
Arize does not publicly disclose pricing. The platform’s strength is in ML operations and model performance monitoring. Its security detection capability, specifically around access anomalies or unauthorized agent deployment, is not part of its design.
Braintrust
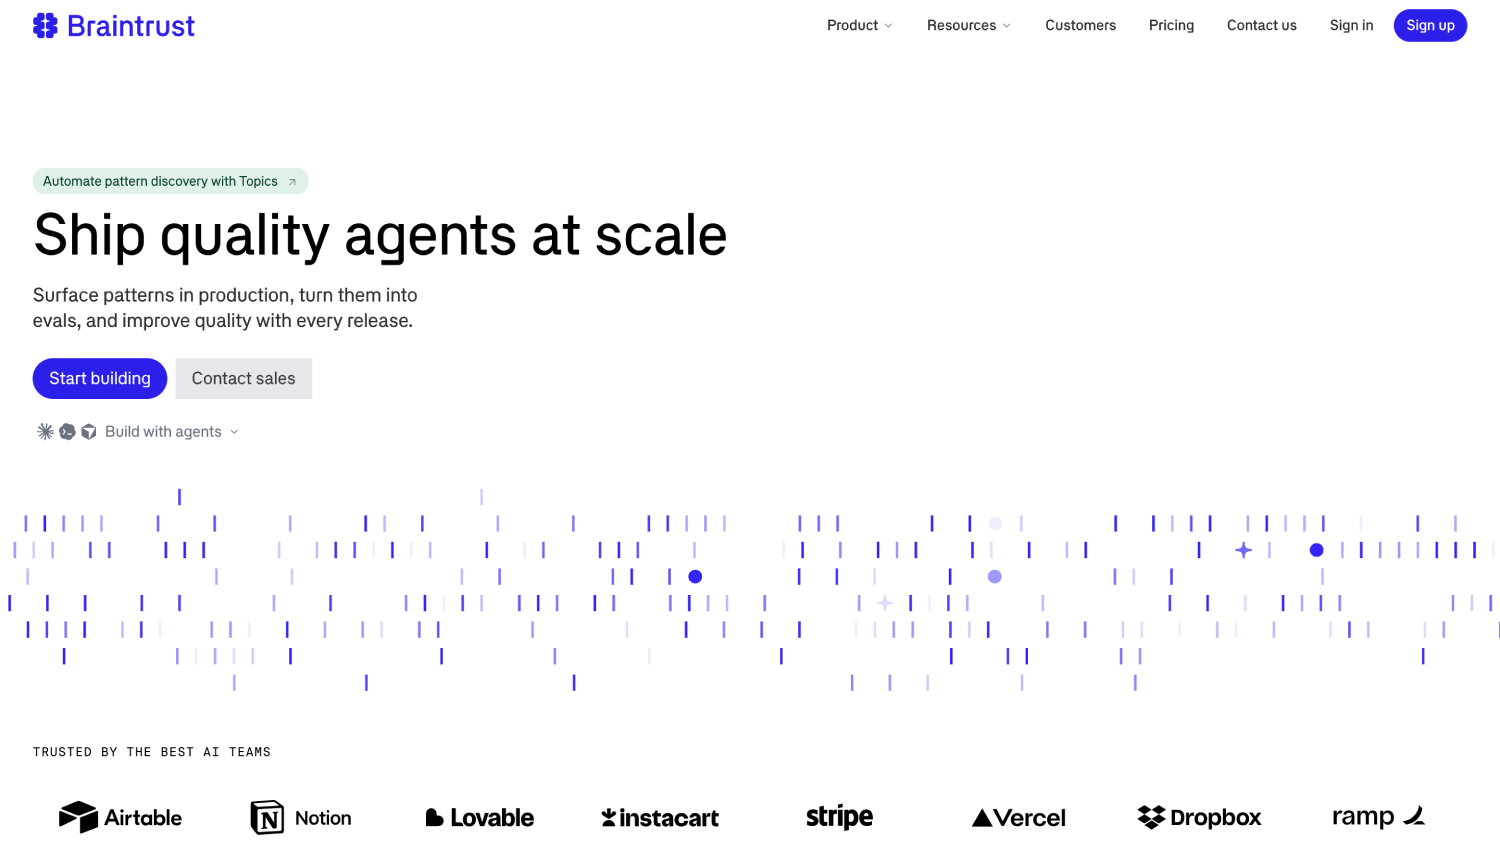
Braintrust is an evaluation and logging platform focused on helping engineering teams score LLM outputs against rubrics and run A/B tests on prompt versions. It logs traces and supports custom scoring functions. Like the other engineering observability tools, it requires instrumentation by the development team and does not provide any mechanism for discovering agents that were not registered by their builders.
Braintrust does not publicly disclose pricing. Its target user is the developer or ML engineer iterating on prompts and evaluating output quality. A security team that inherits a Braintrust dashboard gets a detailed view of agent behavior for the agents the engineering team cared enough to instrument.
Security-Focused Discovery and Monitoring Tools: What They Find That Observability Tools Miss
Zenity
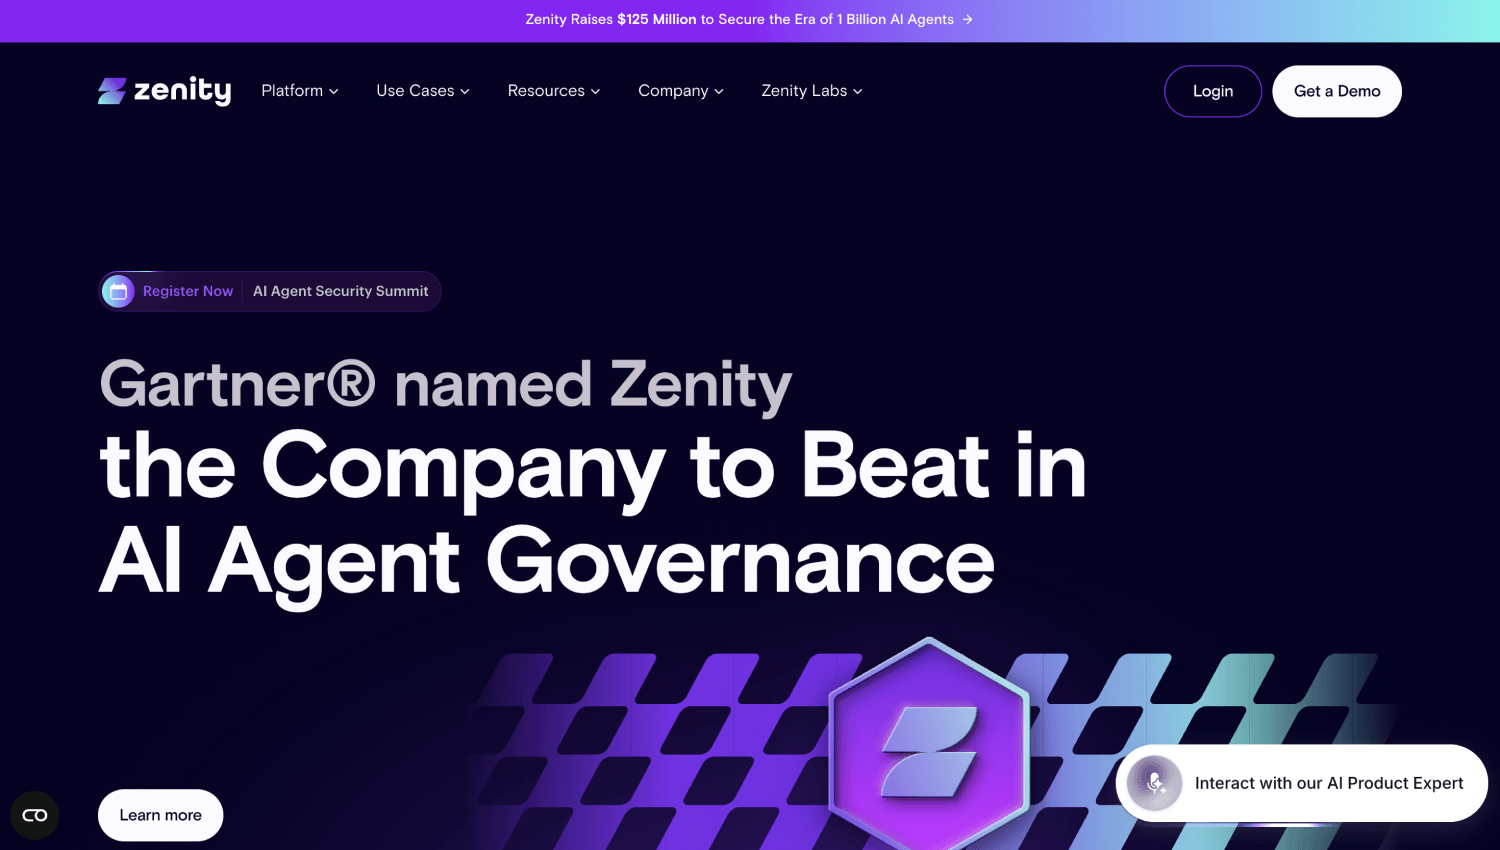
Zenity is built specifically for AI agent security and describes its platform as providing a live inventory of every AI agent in an organization, including which data those agents touch. According to Zenity’s product page, the platform exposes capabilities described as Surface, Enforce, and Protect, oriented around discovering and controlling AI agents across low-code and SaaS environments. Its discovery approach pulls from SaaS platform APIs and OAuth grant data rather than requiring SDK instrumentation from each agent’s development team.
This is the architectural distinction that matters. Zenity finds agents built by business users on low-code platforms, which are exactly the agents that will not appear in any engineering observability tool. The platform also monitors for over-scoped tool grants and tracks changes in what data an agent is accessing over time. Zenity does not publicly disclose pricing. For organizations running significant low-code agent deployments, Zenity’s architecture around that discovery problem is worth evaluating directly with their team to confirm specific platform coverage for your environment.
Noma Security
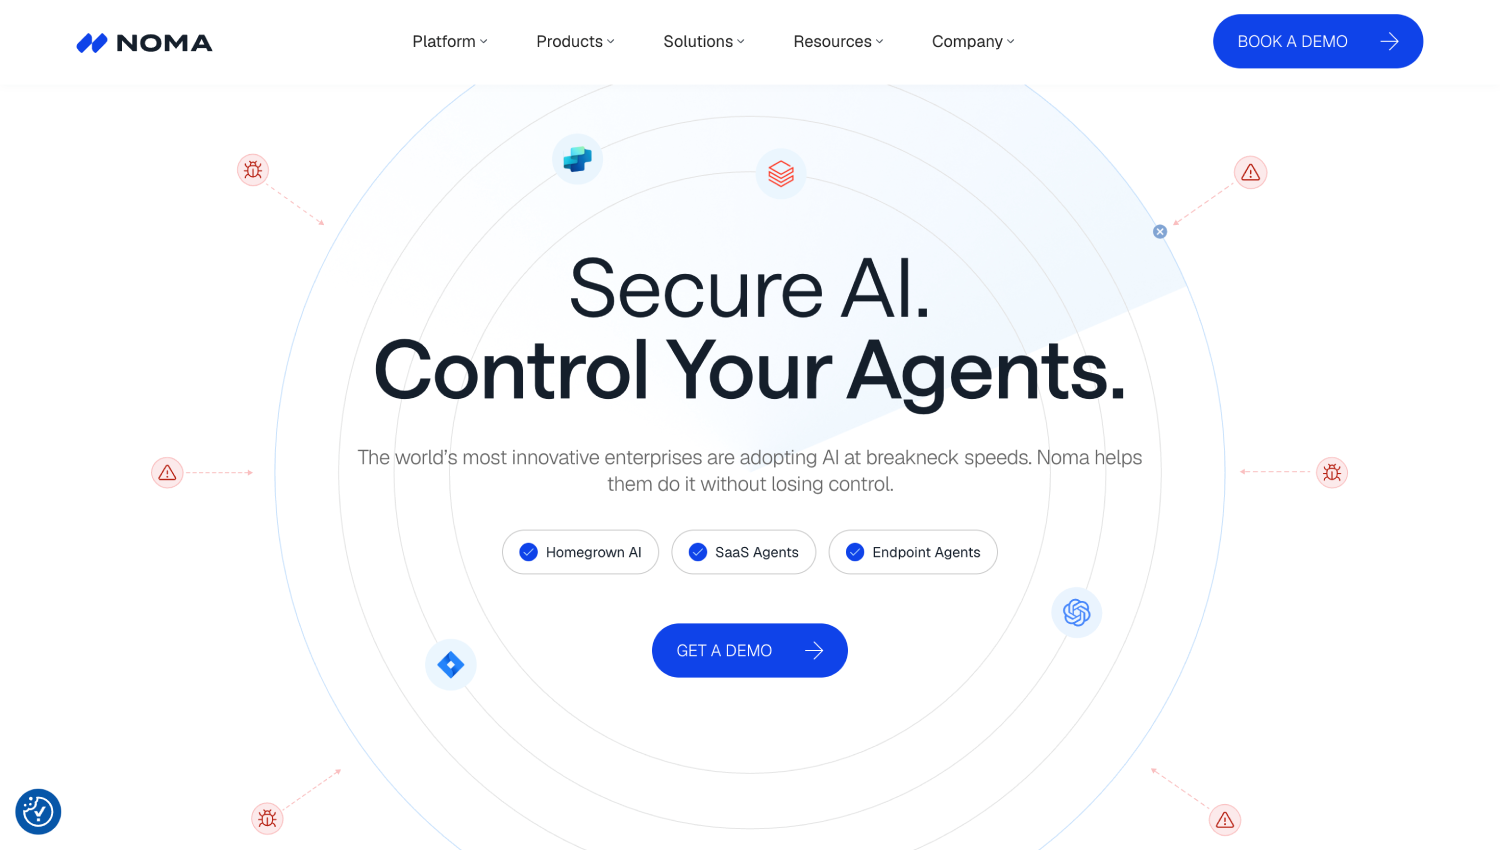
Noma Security positions itself as an AI security platform that covers the full development-to-production lifecycle, including agent discovery, data pipeline security, and runtime monitoring. Its discovery approach connects to source code repositories, CI/CD pipelines, and cloud environments to find AI applications that are in development or already running. This gives security teams visibility into agents before they reach production, not just after deployment.
Noma’s pipeline security coverage, specifically tracking what training data and retrieval sources an agent connects to, addresses a gap that pure runtime monitoring tools miss. Noma does not publicly disclose pricing.
Obsidian Security
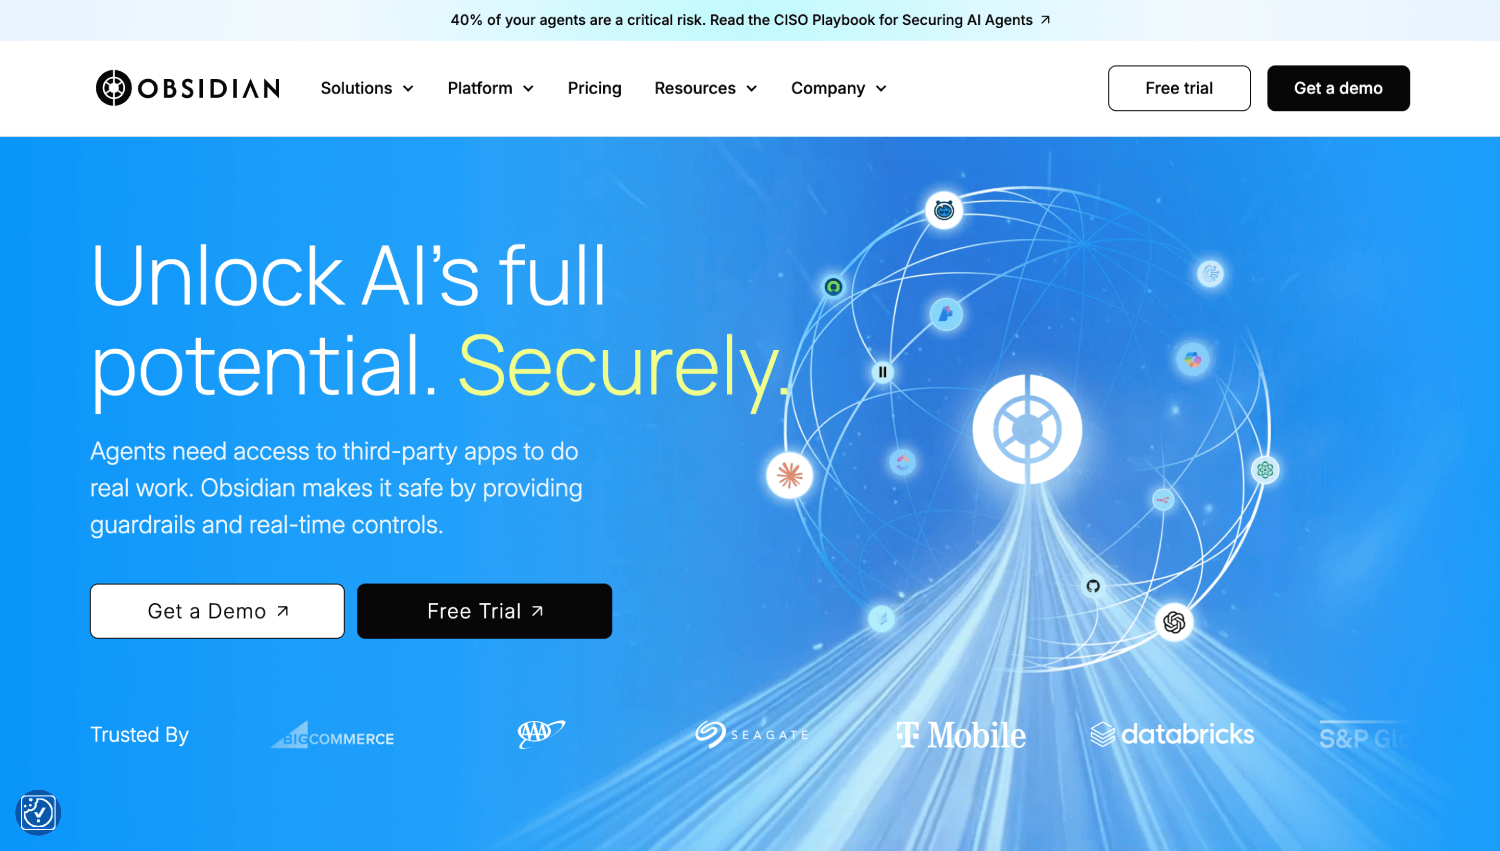
Obsidian Security focuses on SaaS security posture and identity threat detection. Its relevance to the agent discovery problem comes from its OAuth grant analysis: because AI agents frequently operate through OAuth-connected service accounts and delegated permissions, Obsidian’s visibility into SaaS OAuth grants surfaces agents operating under user or service account identities that were not registered through a formal AI governance process.
Obsidian is not an AI-native agent monitoring tool, but it covers the identity layer where many shadow agents hide. Teams that already run Obsidian for SaaS security can use existing coverage to surface AI agents that connected to corporate SaaS through OAuth without going through procurement. Obsidian does not publicly disclose pricing. For organizations running broader AI agent security platforms that need identity-layer coverage, Obsidian represents a complementary data source rather than a standalone solution.
Wiz
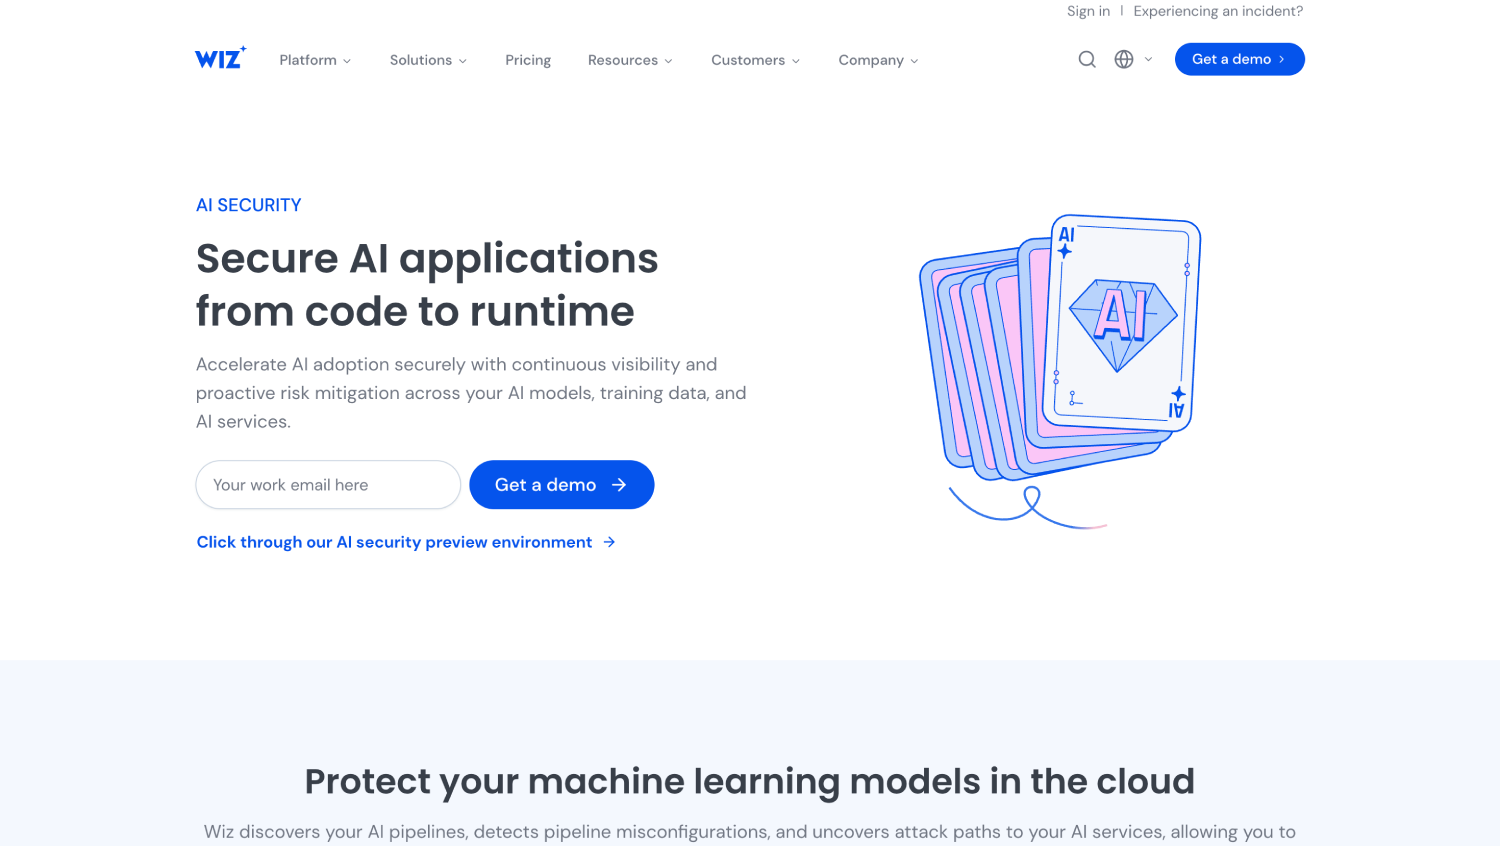
Wiz added AI security posture management capabilities to its cloud security platform. From a discovery standpoint, Wiz scans cloud environments to identify AI workloads, including agent runtimes, model endpoints, and data stores that agents access. For organizations already running Wiz for cloud security, this surfaces AI agents deployed into AWS, Azure, or GCP without going through a security review.
Wiz’s strength is cloud infrastructure context: it can show not just that an agent exists, but what IAM roles it runs under, what S3 buckets or database resources it can reach, and whether its network exposure is consistent with its stated function. This makes Wiz useful for the inventory and blast radius assessment problem, particularly in cloud-native environments. Wiz does not publicly disclose pricing.
Prompt Security
Prompt Security operates as an AI gateway and content inspection layer rather than a discovery tool. It sits in the request path between users or applications and LLM APIs, scanning prompt inputs and outputs for data loss patterns, policy violations, and prompt injection attempts. This is layer four in the Agent Visibility Stack described above.
Prompt Security does not solve the shadow agent discovery problem, but it addresses a different gap: ensuring that agents you do know about are not being used to exfiltrate sensitive data or manipulated through injected instructions. For teams that have completed their initial agent inventory, Prompt Security adds runtime content enforcement. For teams that have not, it is the wrong first purchase. The related problem of locking down what tools agents can call is covered in depth in the SecurityOpsWire analysis of MCP security tools for agent-to-tool access control.
Engineering Observability vs. Security Discovery: Full Comparison
| Tool | Category | Finds Shadow Agents | Requires SDK Instrumentation | Self-Hosting Available | Primary Buyer | Public Pricing |
|---|---|---|---|---|---|---|
| LangSmith | Engineering observability | No | Yes | Yes (cloud, BYOC, self-hosted; Enterprise) | ML/LLM engineers | No |
| Langfuse | Engineering observability | No | Yes | Yes (open-source) | ML/LLM engineers | Free tier + usage-based |
| Arize AI | Engineering observability | No | Yes | Yes (Phoenix, local/eval) | ML engineers, data scientists | No |
| Braintrust | Engineering observability | No | Yes | No | LLM product engineers | No |
| Zenity | Security discovery | Yes | No | No | Security teams | No |
| Noma Security | Security discovery + runtime | Yes | No | No | Security teams | No |
| Obsidian Security | SaaS security / identity | Partial (via OAuth) | No | No | Security teams | No |
| Wiz | Cloud security / CSPM | Yes (cloud workloads) | No | No | Cloud security teams | No |
| Prompt Security | AI gateway / content inspection | No | Partial (gateway routing) | No | Security teams | No |
How Does Per-Trace Pricing Scale in Production Agent Environments?
Per-trace pricing is the default model for most engineering observability platforms, and it behaves predictably in development and staging environments. Production agent fleets are different.
Consider a team running three customer-facing agents: a support triage agent, a document Q&A agent, and an internal IT assistant. At moderate usage, each agent might process 5,000 interactions per day. Each multi-step agentic interaction generates between 8 and 25 trace spans depending on the number of tool calls and retrieval steps. At 15 spans average and 15,000 daily interactions across three agents, that is 225,000 spans per day, roughly 6.75 million spans per month. Per-trace pricing that looks negligible in a demo environment adds up at that volume.
Before committing to a per-trace observability platform for production use, ask the vendor for a written estimate based on your expected daily interaction volume, average tool call count per agent, and trace retention period. Most vendors will provide this, and the number often surprises teams that sized based on development traffic. Security-focused discovery tools typically use a different pricing model based on connected environments or managed agents, not per-trace volume, which makes their cost behavior more predictable as the agent fleet grows.
Data Residency and Self-Hosting: Which Tools Let You Keep Traces In-House
Agent traces are not generic telemetry. They contain the full text of user prompts, which may include PII, internal business context, customer names, and proprietary process information. Before routing trace data to any third-party platform, legal and compliance teams need to weigh in, particularly for organizations subject to HIPAA, GDPR, or sector-specific data handling requirements.
Among the engineering observability tools, Langfuse’s open-source self-hosted deployment is the strongest data residency option. The full platform, including trace storage, evaluation, and the web UI, runs entirely within your infrastructure. Arize Phoenix is also open-source and self-hostable, with the Phoenix project focused on local development and evaluation workflows rather than production-scale deployment. According to LangSmith’s official documentation, the platform offers managed cloud, bring-your-own-cloud (BYOC), and self-hosted deployment options for teams with data residency requirements, with Enterprise plan options available by contacting the LangChain team.
On the security side, the discovery-focused vendors covered here , Zenity, Noma, Obsidian, and Wiz , are offered as managed cloud services, and their respective product pages do not describe self-hosted deployment options. Confirm deployment model directly with each vendor for your specific environment. For organizations with strict data residency requirements, this typically means using a self-hosted engineering observability tool for trace storage while using cloud-connected security tools only for metadata and telemetry that does not include raw prompt content.
How to Run Your First Agent Discovery Pass
A first inventory pass does not require purchasing a dedicated tool. The goal is to answer four questions: what agents are running, who authorized them, what data they can access, and who is responsible for them going forward. The following sequence works for most mid-market through enterprise environments and can be completed in two to three weeks with existing tooling in many cases.
- Pull OAuth grants from your identity provider and major SaaS platforms. Microsoft Entra ID, Google Workspace, Salesforce, and ServiceNow all expose OAuth grant data through admin APIs or audit logs. Look for service principals, third-party app registrations, and delegated permission grants with AI-related names or scopes. This surfaces agents that business users connected through low-code platforms or direct API integrations.
- Query your cloud provider’s resource inventory for AI service usage. AWS Bedrock, Azure OpenAI, and Google Vertex AI all generate API call logs. A query against CloudTrail, Azure Monitor, or Cloud Logging for calls to foundation model inference endpoints reveals what workloads are calling AI APIs, even if those workloads were not disclosed to the security team.
- Check your API gateway and egress proxy logs for calls to known LLM API endpoints. OpenAI, Anthropic, Cohere, Mistral, and other provider API hostnames are known. Filter egress logs for these destinations to identify agents calling external LLM APIs directly from production systems.
- Survey engineering and business unit leads with a short questionnaire. Self-reported inventory misses shadow agents by definition, but it adds owner context to agents you already found and surfaces development-stage agents that are not yet generating network traffic or OAuth grants.
- Assign ownership and classify by risk tier. Agents with access to production data stores, customer records, or external communication channels go into a higher-priority review tier than read-only internal knowledge base agents. Risk tier drives the monitoring and control investment per agent.
After completing this pass, the question of which tool to buy becomes clearer because you know the size and composition of your actual fleet. A team that discovers 400 agents, 300 of which are Microsoft Copilot variants built on Power Platform, has a different tool requirement than a team that discovers 12 custom-built Python agents running on Kubernetes.
Which Tools Are Right for Specific Environments?
For organizations running significant low-code agent deployments , including Microsoft Copilot agents, Power Platform, and similar citizen-developer platforms , Zenity’s architecture around SaaS-layer and OAuth-based discovery is built for that problem. These environments generate most of their shadow agent volume through business users rather than software engineers. Confirm specific platform coverage directly with Zenity before purchase, as the vendor’s product page does not enumerate individual SaaS integrations.
For cloud-native organizations with most of their agent workloads running as containerized services on AWS, Azure, or GCP, Wiz’s existing cloud inventory and the AI-specific additions to its CSPM layer give security teams agent discovery without deploying a separate tool. Teams already paying for Wiz can run a discovery pass against their existing connected cloud accounts. For teams evaluating broader agent security controls, the SecurityOpsWire comparison of AI agent security platforms covers how these tools fit into a broader control architecture.
For engineering teams that have already built out their agent fleet on LangChain or a similar framework and need to add security visibility without changing existing observability infrastructure, Noma’s approach of connecting to CI/CD pipelines and source repositories adds a security layer without requiring the engineering team to modify their instrumentation. This matters in practice: security tools that require engineering teams to change their setup face adoption friction that delays the visibility they are meant to provide.
Frequently Asked Questions
What is the difference between AI agent observability and AI agent security monitoring?
Observability tools like LangSmith or Langfuse are built to help engineering teams understand why an agent produced a given output, how long each step took, and whether output quality is degrading. Security monitoring focuses on whether an agent is authorized to exist, what data it can access, whether its behavior is consistent with its stated function, and whether prompt inputs or outputs contain policy violations. The signal sources, alert types, and buyers are different. Observability is an engineering function; security monitoring is a security function.
How do shadow agent discovery tools actually find agents that nobody registered?
Security discovery tools find shadow agents by analyzing data sources that exist independently of developer instrumentation. These include OAuth grant tables in identity providers, API call logs from cloud AI services, egress proxy logs showing traffic to LLM API endpoints, and SaaS platform audit logs that record when third-party applications connect through official integration marketplaces. An agent built by a business analyst in Power Platform leaves an OAuth grant in Entra ID even if it appears in no engineering observability tool. Discovery tools that read from these control plane data sources find agents regardless of whether the development team chose to instrument them.
Is self-hosting an AI observability tool worth the operational overhead for security reasons?
For organizations where agent traces contain PII, customer data, or internal business context, self-hosting a trace storage layer is worth evaluating seriously. Langfuse’s open-source deployment and Arize Phoenix are the two strongest self-hosted options. The operational overhead is real: you own the infrastructure, upgrades, and availability. The compliance benefit is that raw prompt and completion text stays within your environment. For organizations subject to HIPAA, GDPR, or government data handling requirements, that benefit frequently outweighs the operational cost.
How does per-trace pricing behave when an agent fleet scales?
Per-trace pricing is volume-linear: costs scale with interaction volume, average steps per interaction, and retention period. In development, this is usually negligible. In production, a multi-step agent handling thousands of user interactions per day can generate millions of trace spans per month. Before signing a per-trace agreement for production observability, ask the vendor for a written cost estimate based on your expected daily volume and average tool call count per interaction. Security discovery tools typically use per-environment or per-agent-count pricing, which is more predictable at scale.
What signals matter for security versus reliability in agent monitoring?
Reliability signals include latency per step, token consumption, retrieval accuracy, output quality scores, and error rates. These tell an engineering team whether the agent is working correctly. Security signals include which external endpoints the agent is calling, whether tool grant scopes have expanded since deployment, whether the agent is accessing data stores outside its original authorization, whether prompt inputs contain injection patterns, and whether outputs contain content that matches data loss prevention patterns. These signals exist in different systems and require different detection logic. A dashboard built for reliability will not surface most security-relevant events.
Should the security team or the engineering team own the agent inventory?
Neither team should own it alone. Engineering teams know what they built but have no visibility into agents deployed by business units on low-code platforms. Security teams can discover the full inventory but lack context about each agent’s function and intended data access. The practical arrangement that works is joint ownership with security running the discovery pass, engineering providing context for agents they built, and a shared register maintained in a tool both teams can access. The harder question is who owns ongoing monitoring, which depends on whether the organization has a dedicated AI security function or distributes that responsibility across cloud security and application security teams.
Does Wiz’s AI security coverage replace a dedicated agent discovery tool?
For cloud-native environments, Wiz’s cloud inventory and AI security posture management features cover agents deployed as cloud workloads. What Wiz does not cover is agents built on SaaS platforms outside the cloud infrastructure perimeter: low-code platform agents or third-party AI services connected through OAuth to corporate SaaS. Organizations where most AI agent deployment happens in cloud infrastructure get meaningful coverage from Wiz. Organizations where business users are building agents on low-code platforms need a tool with SaaS-layer discovery, such as Zenity, to cover that population.
The Inventory Pass Is the Product
Most buying decisions in this category get made backwards. Teams evaluate trace dashboards and ask which one has better visualization before they know how many agents are running or who authorized them. The first deliverable that matters is a list: every agent, its owner, its data access scope, and its risk tier. A spreadsheet built from OAuth grant data and cloud API logs is more operationally useful than a polished trace UI covering 30% of the actual fleet.
The tooling decision follows from inventory composition. A fleet that is mostly Microsoft Copilot and Power Platform agents points toward Zenity. A fleet that is mostly containerized Python agents in AWS points toward Wiz or Noma. A fleet where the engineering team has already instrumented everything through LangChain points toward LangSmith or Langfuse for observability, with a security tool layered on top for control plane visibility. The tools are not substitutes for each other; they cover different parts of the same problem.
The reader’s belief that engineering observability already gives security the visibility it needs is reasonable from a distance and wrong in practice. The agents that engineering teams instrument are not the agents that create the most security risk. The agents that create the most risk are the ones nobody thought to register. Finding those requires a different architecture, a different data source, and in most cases a different buyer relationship with a different category of vendor.